As I mentioned in my first post, my wife and joined the Western Bulldogs this year. We received our first copy of "The Bulldog". The player listing caught my eye : stats about the players : age, weight, height, AFL Debut Year.


So here are my statistics and charts about this year's WB players:
- 47 players listed
- 6 players share birthdays with one other person
A plot of height versus weight shows a clear linear relationship:
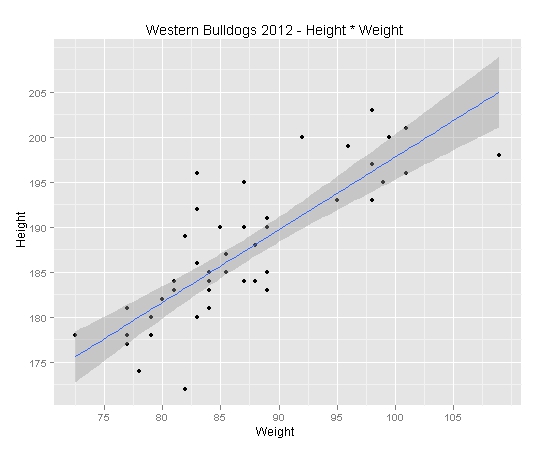
From this relationship, we can find equations to predict height from weight, or vice versa:
Height = 117.108 + 0.8078 * weight
Weight = - 68.7018 + 0.8316 * height.
The R code to produce the chart above is :
library(ggplot2)
ggplot(wb, aes(WT,HT))+ geom_point() + scale_x_continuous("Weight") + scale_y_continuous("Height") + opts(title = "Western Bulldogs 2012 - Height * Weight") + geom_smooth(method = "lm")
This code produces a straight line smoother called "linear model".
The following code produces the same chart, with a different smoother:

ggplot(wb, aes(WT,HT))+ geom_point() + scale_x_continuous("Weight") + scale_y_continuous("Height") + opts(title = "Western Bulldogs 2012 - Height * Weight") + geom_smooth()
The geom_smooth() function in this case uses the default smoother "Loess" (for datasets up to n = 1,000 ). For the mathematically inclined, this smoother fits a polynomial line.
There is virtually no relationship between height and age:

ggplot(wb, aes(Age1Jan2012, HT))+ geom_point() + scale_x_continuous("Age") + scale_y_continuous("Height") + opts(title = "Western Bulldogs 2012 - Height * Age") + geom_smooth(method = "lm")
or
weight and age :

ggplot(wb, aes(Age1Jan2012, WT))+ geom_point() + scale_x_continuous("Age") + scale_y_continuous("Weight") + opts(title = "Western Bulldogs 2012 - Weight * Age") + geom_smooth(method = "lm")
And finally, here is the age distribution:

qplot(Age2, data = wb, geom = "histogram", binwidth = 1)+ scale_x_continuous("Age") + scale_y_continuous("Count") + opts(title = "Western Bulldogs 2012 - Number By Age")
No comments:
Post a Comment